Interface and Project Management
The Ride Simulator is built around a flexible multi-pane dashboard that you can fully customize to your needs. You work with freely arrangeable panes, saved projects, and a comparison mode for A/B scenarios.
The Dashboard Layout
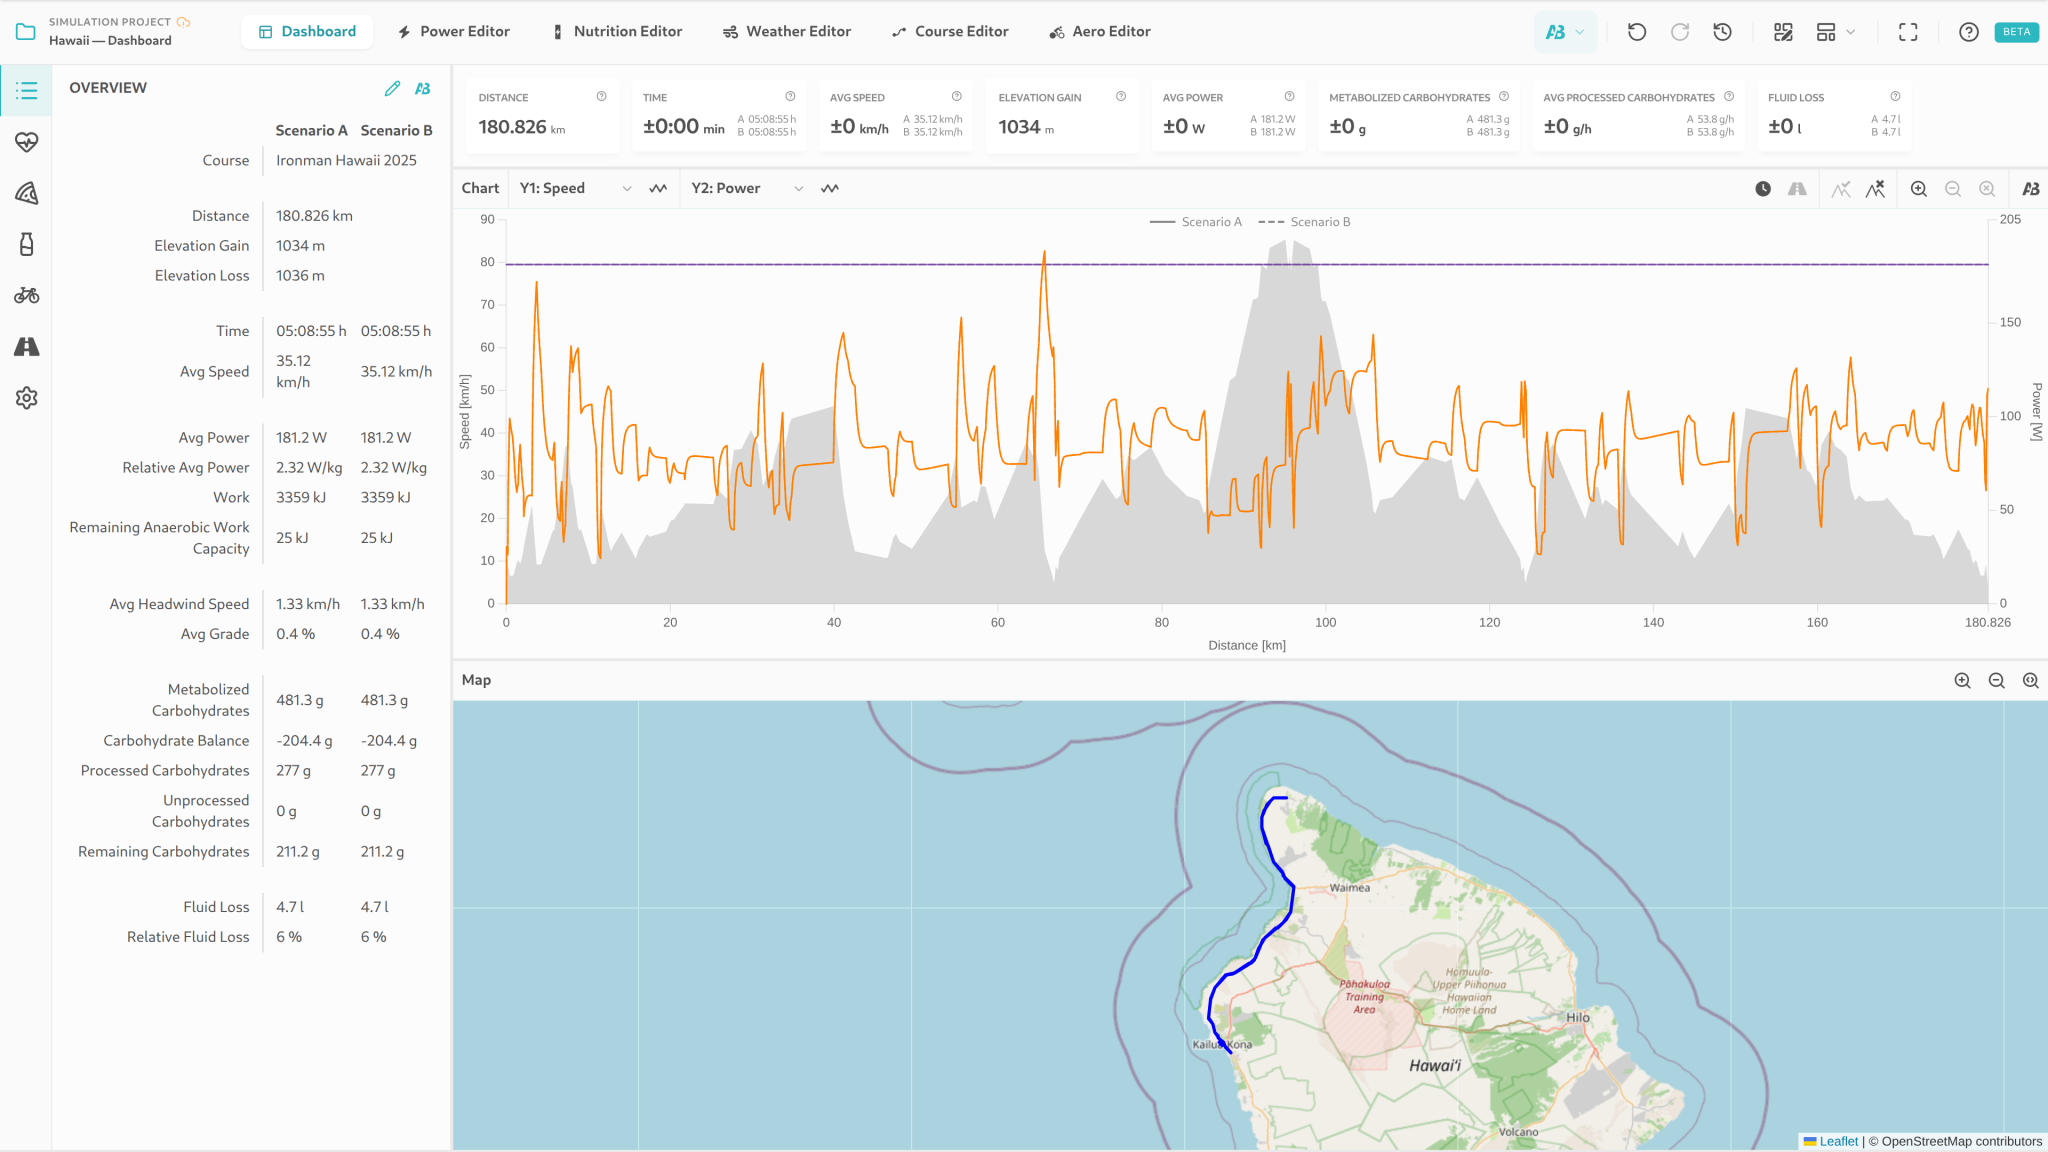
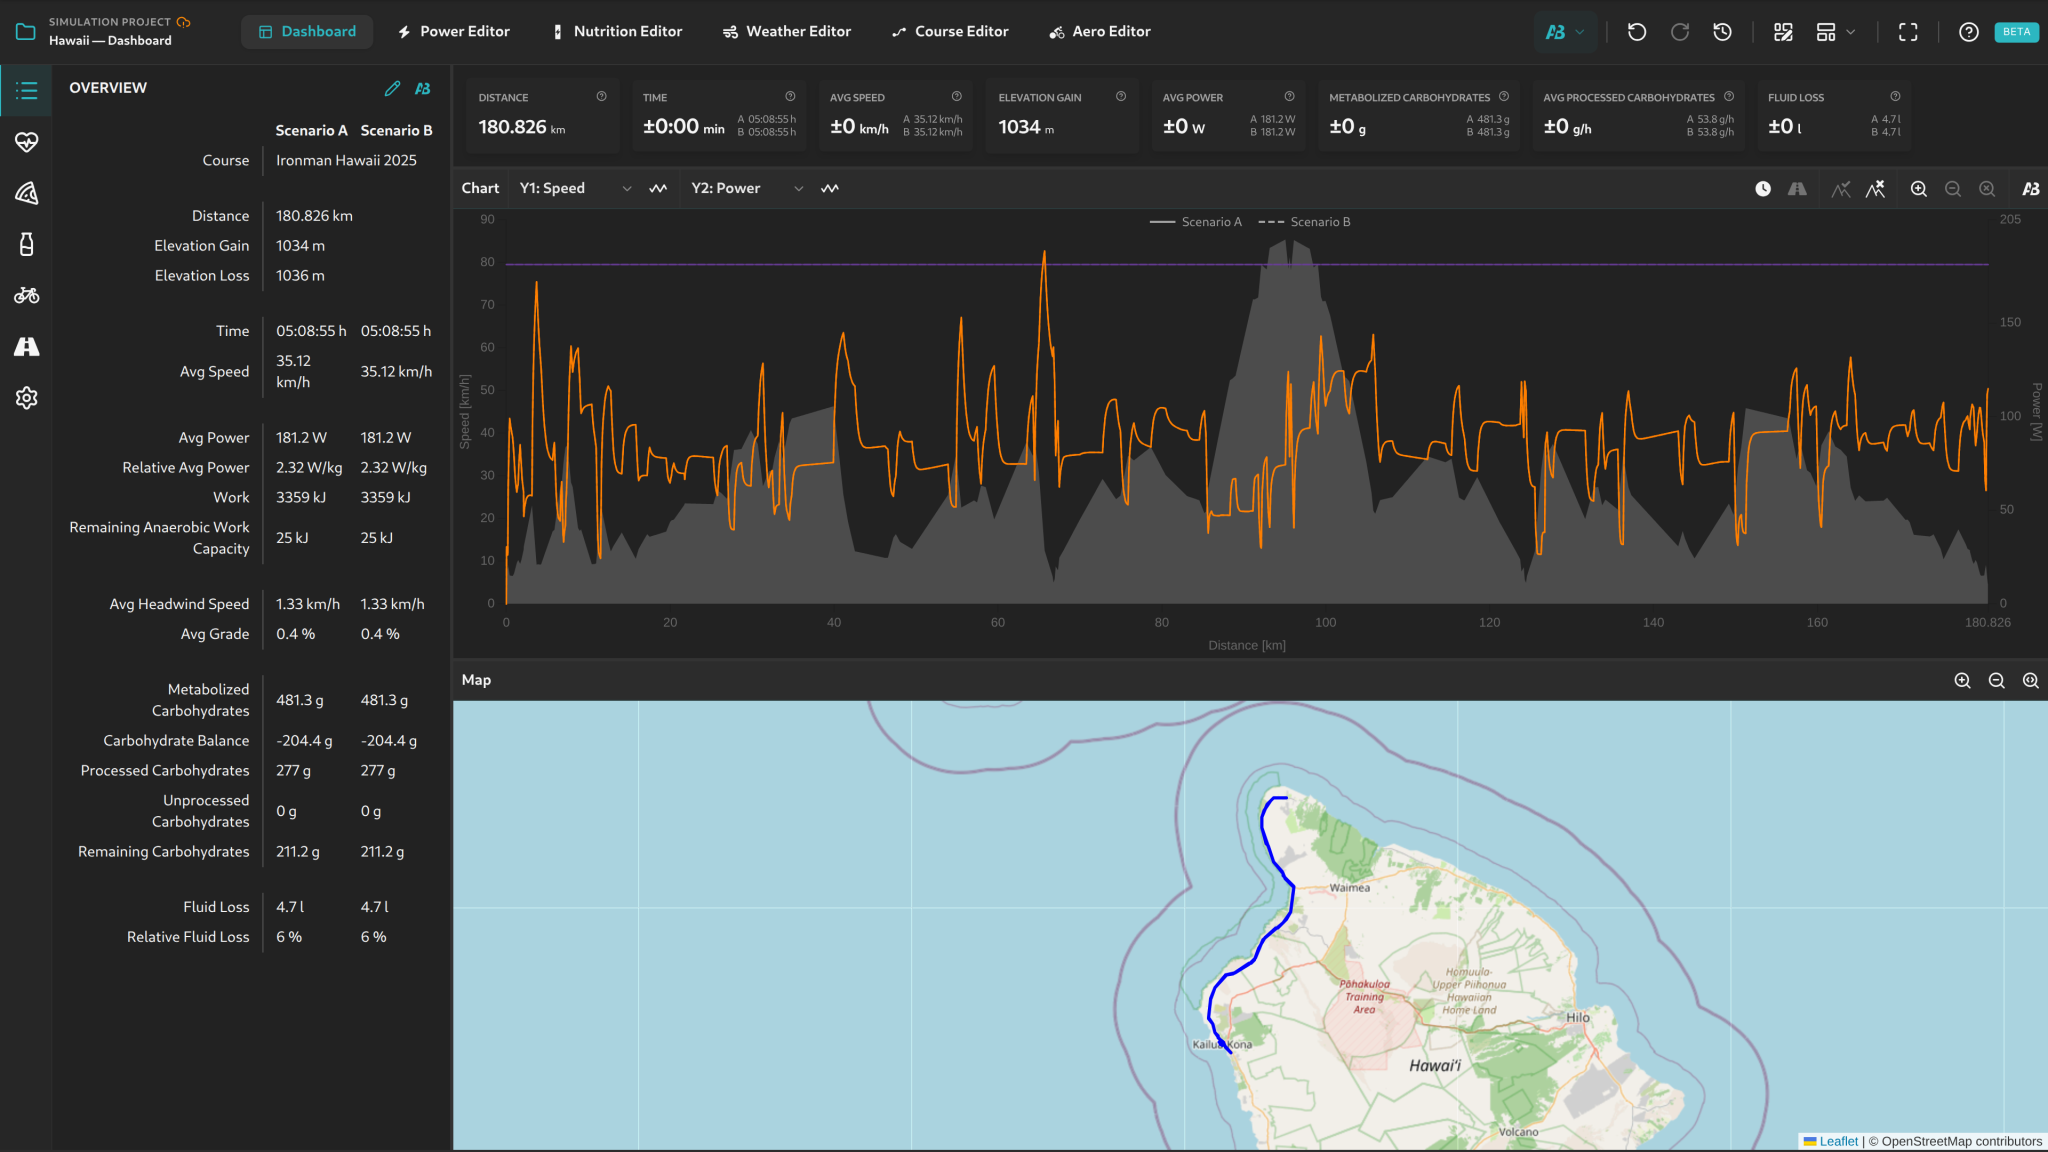
The dashboard is divided into multiple panes that you can arrange freely. You can split panes horizontally and vertically, rearrange them, and resize them. Each pane shows a specific view – from maps and charts to nutrition or power editors.
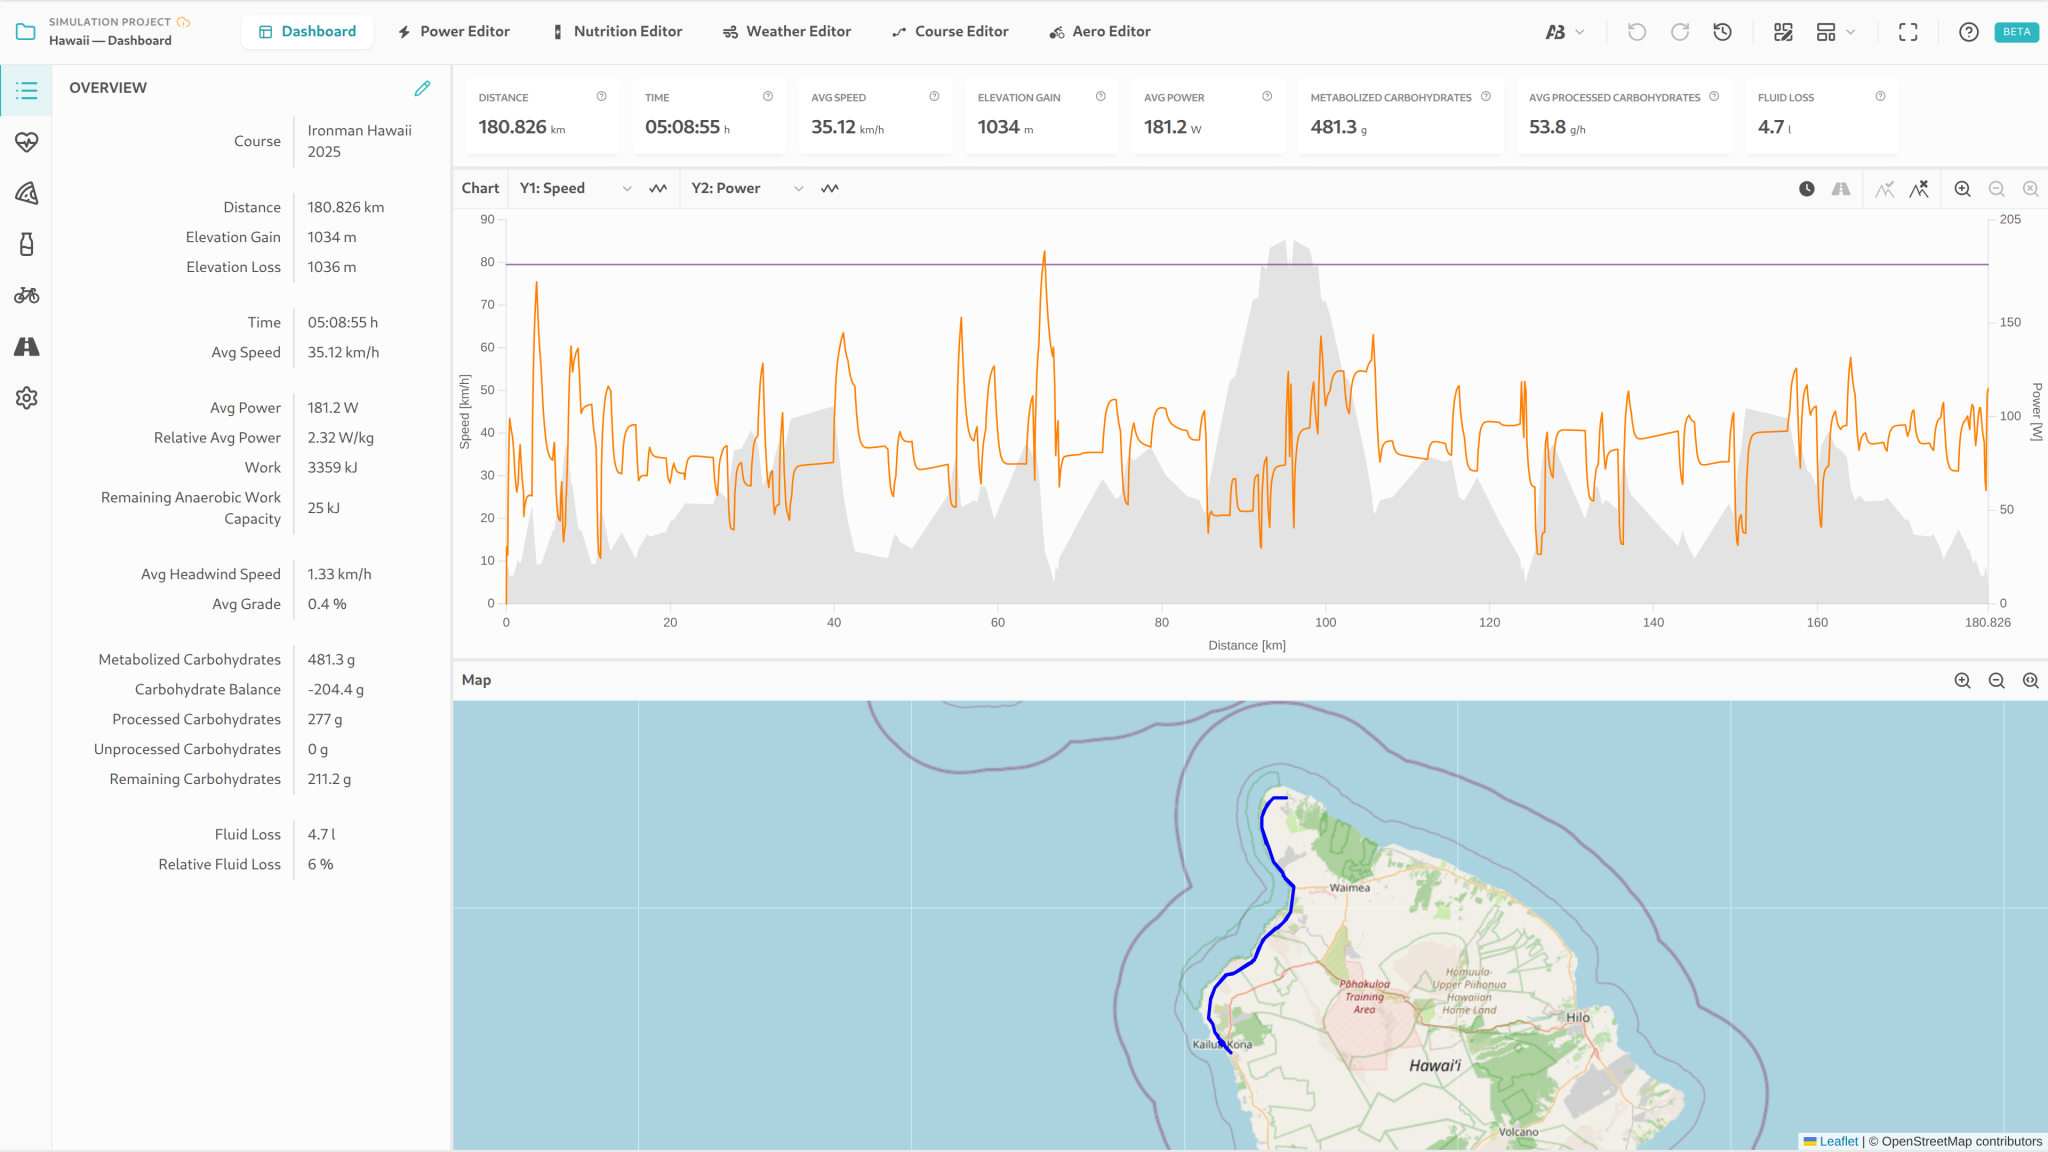
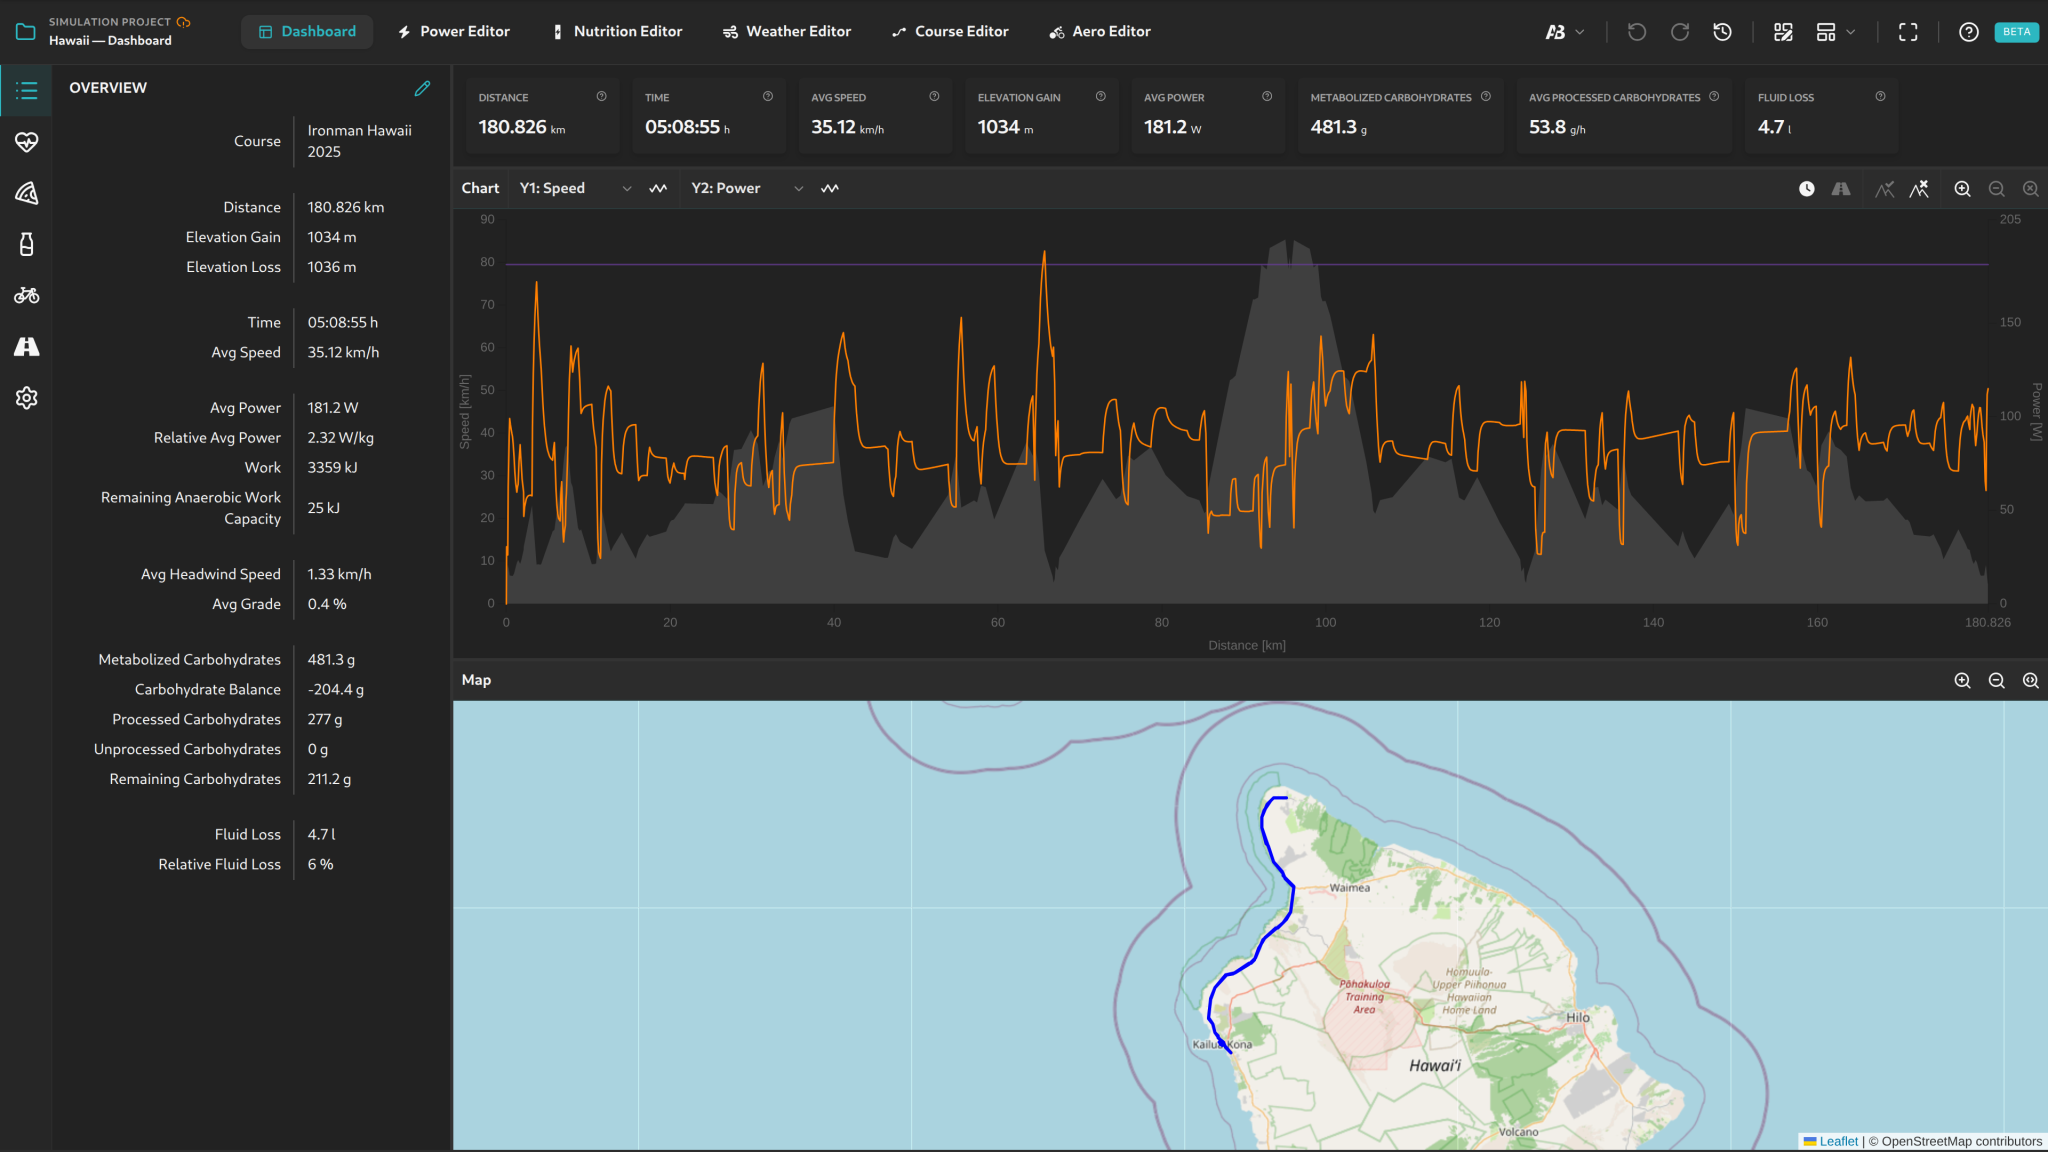
The sidebar provides several tabs with metrics and settings:
- Overview: A configurable table of computed metrics – which metrics appear is set through "Edit Overview Metrics".
- Physiology: VO2max, VLamax, body weight, and bodyfat; the anaerobic work capacity (W′) and its estimation option appear under the advanced options.
- Nutrition: Carbohydrate availability and maximum processable carbohydrate intake; carbohydrate buffer, pre-depletion, and the carbohydrate multiplier under the advanced options.
- Hydration: Sweat rate and sodium content in sweat.
- Equipment: Equipment weight and drag area (CdA); drivetrain efficiency, rolling resistance coefficient, and the two CdA adaptations under the advanced options.
- Activity: Initial speed and maximum allowed speed; maximum lean angle and maximum braking deceleration under the advanced options.
- Settings: Simulation objective and interface complexity, the grids of the individual editors, whether power specifications are linked to threshold, synchronisation of hover and zoom across charts, the carbohydrate-availability and anaerobic-capacity warnings, preferred nutrition brands, and the option to save the layout with the project.
Available Panes
The following panes can be added to the dashboard:
- Map: Interactive map view showing the course route (only available for imported courses with GPS data).
- Chart: Flexible charting with selectable data series (power, speed, elevation, nutrition data, and more) on primary and secondary Y-axes. Supports zoom, pan, and multiple smoothing levels.
- Yaw Distribution: Dedicated chart showing the distribution of the apparent-wind yaw angle along the course — either signed (wind from the left vs. right) or as a magnitude.
- Power Editor: Define power output along the course in a chart or table view.
- Course Editor: Create or edit elevation profiles and import course files.
- Weather Editor: Set weather conditions (temperature, wind, pressure, humidity) along the course.
- Nutrition Editor: Plan food intake using real sports nutrition products.
- Aero Editor: Define drag area (CdA) and drafting settings.
- Sidebar: Displays detailed information in tabs (see above).
- Metrics: Summary of key computed metrics with optional A/B comparison.
To add or rearrange panes, enable the "Edit Layout" mode using the button in the main navigation bar. In this mode, you can move panes, change their type, and resize them. To add a new pane, click the "plus" icon that appears on the separator between panes.
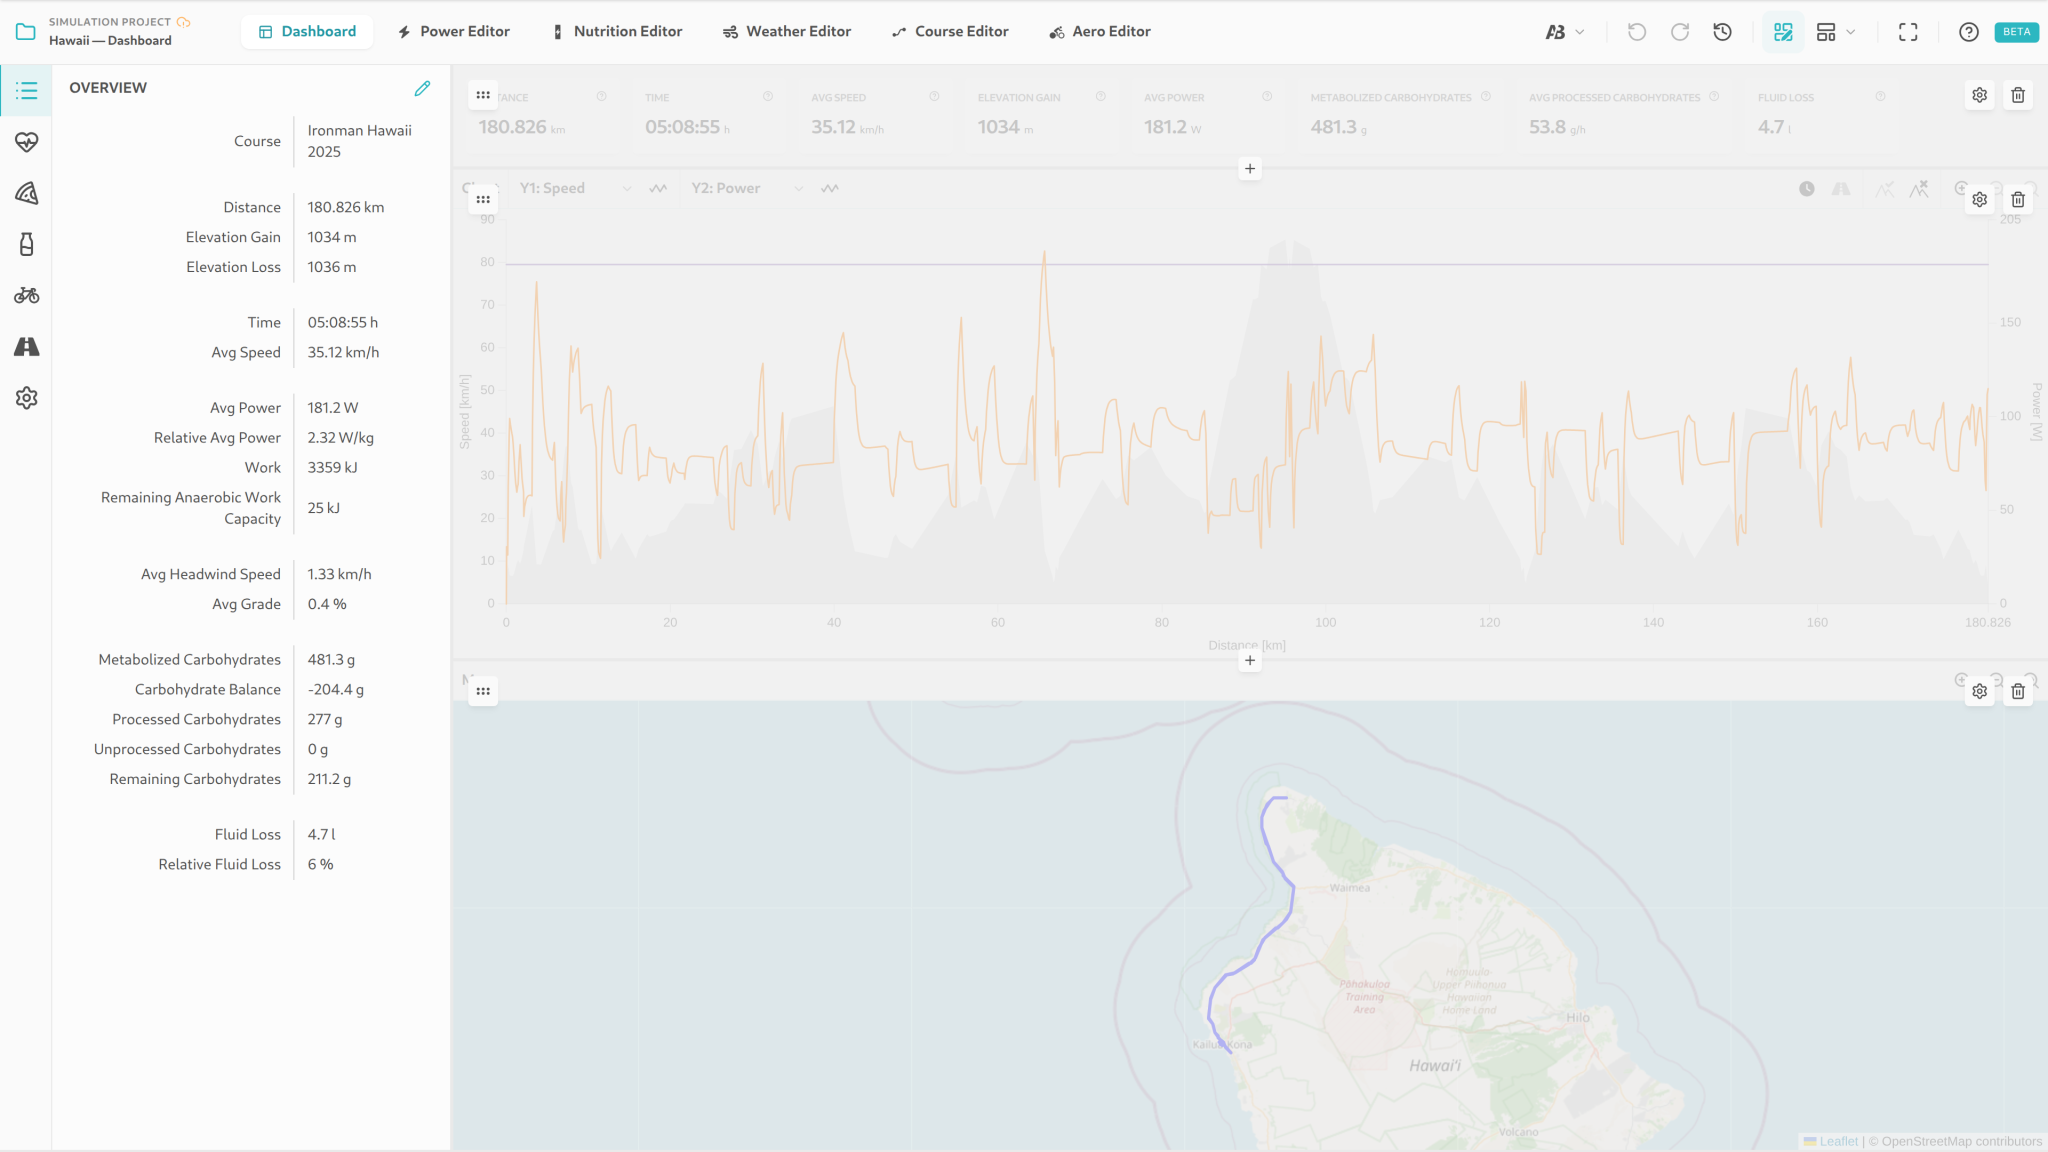
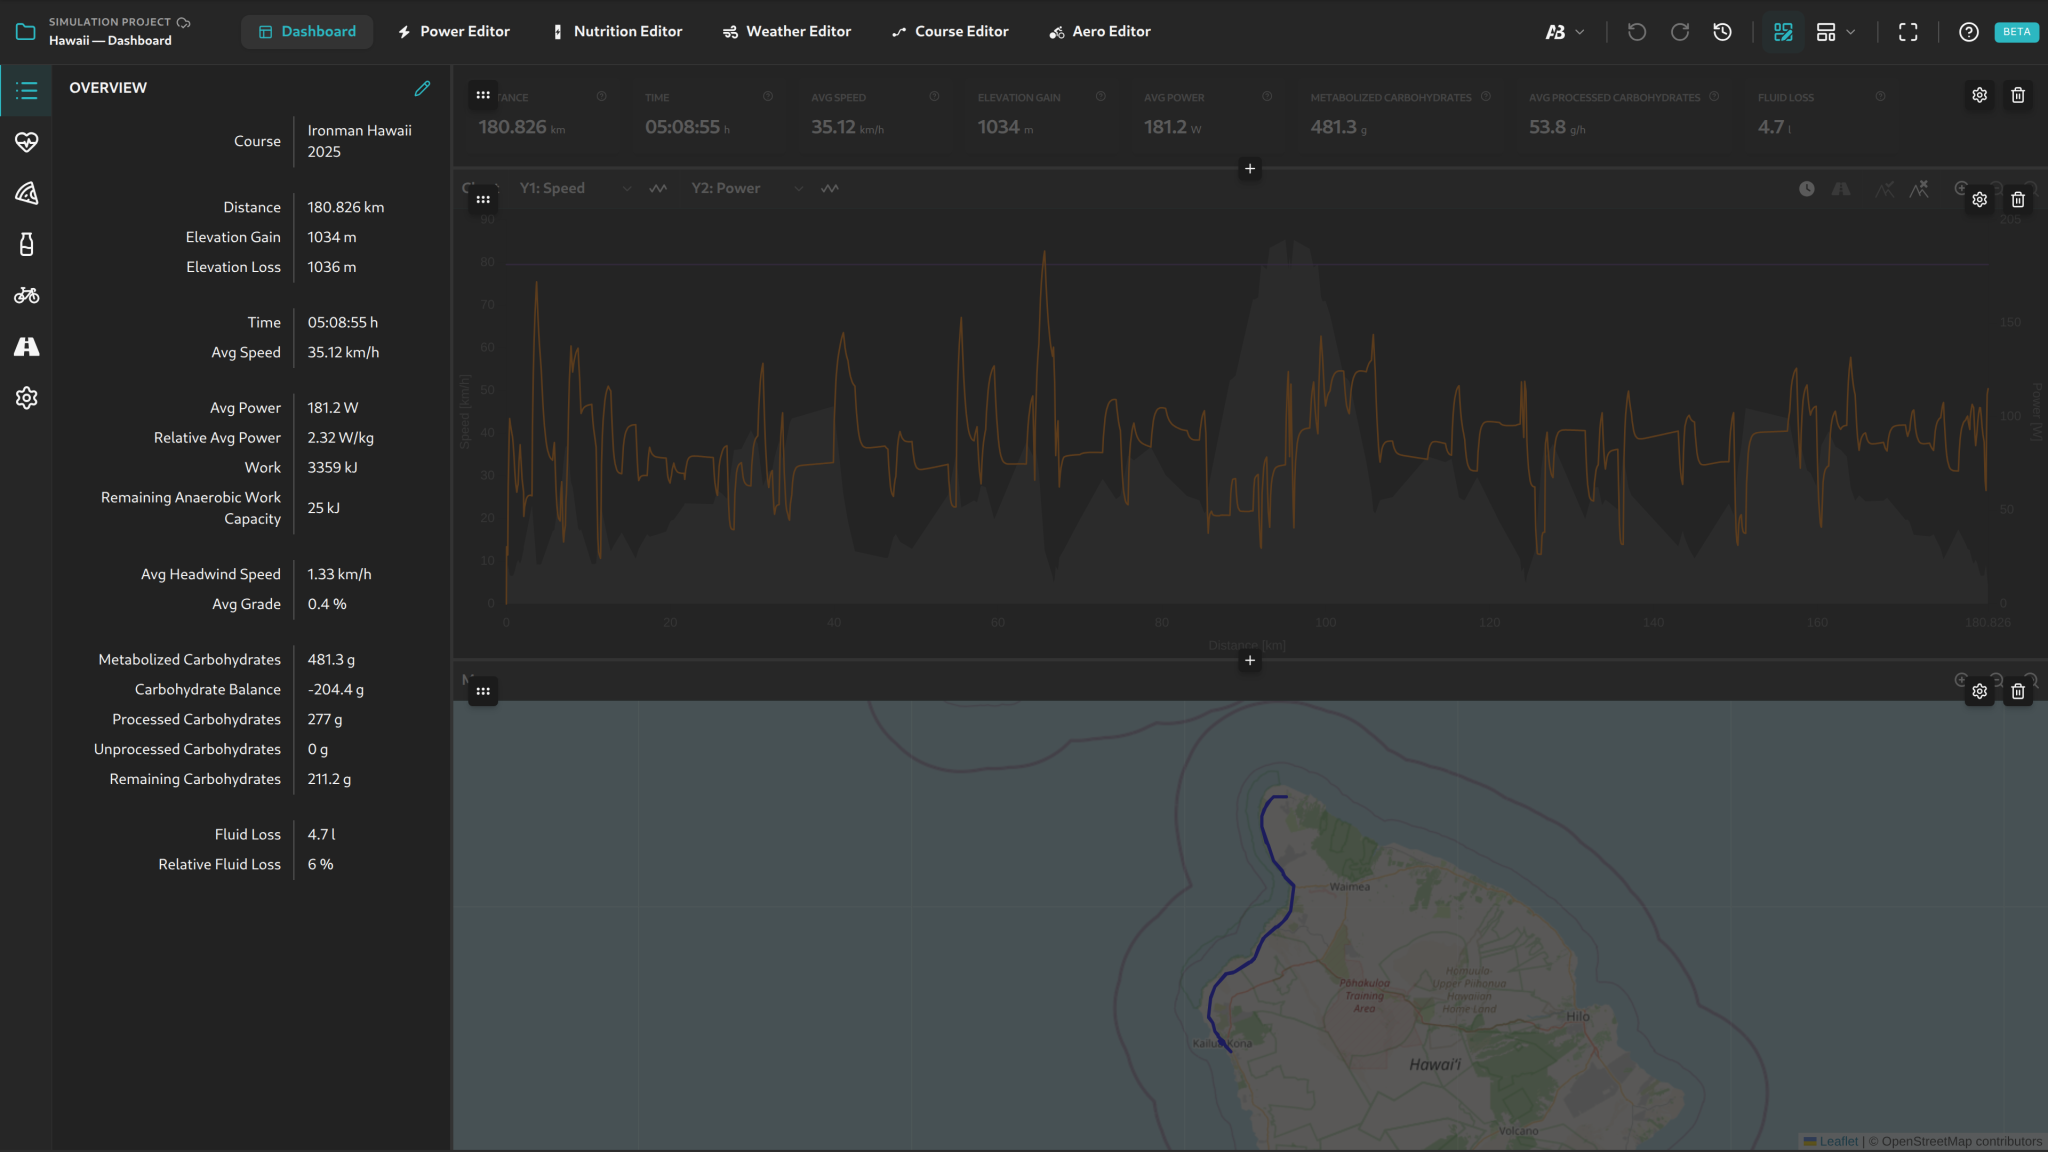
Rather than placing every pane by hand, Apply Layout Template offers ready-made arrangements — single pane, two columns, two rows, three columns, a 2×2 grid, or a metrics strip with a main pane. A template applies to the current page (dashboard or one of the editors), and you choose the pane type for any empty slots. Panes that do not fit the template are listed beforehand and removed when it is applied. Reset Layout returns to the default arrangement.
Mobile View
On narrow screens the simulator switches to a dedicated mobile view with a fixed structure: a bar switches between overview, charts, and the specifications, and the editor is revealed when needed. Freely arranging panes and editing the layout remain desktop-only, so the mobile feature set is slightly reduced.
Creating and Opening Projects
Every simulation is stored as a project. You can create a new project, open existing ones, or start from pre-built templates. The project name can be changed at any time.
- New Project: Opens a six-step dialog: project name, simulation objective and interface complexity, bike type and equipment level; then course, targeted average power, physiology (imported from an analysis or entered manually), preferred nutrition brands, and the starting weather conditions. Every value can be changed later.
- Open Project: Access your saved simulations.
- Presets: Start with pre-configured scenarios for common use cases.
Simulation Objective and Interface Complexity
Two settings determine how the simulator presents itself when a project is created:
- Simulation objective: Wholistic, Nutrition, or Speed. The choice determines which panes and metrics are foregrounded by default — Nutrition brings the nutrition editor and the carbohydrate metrics forward, Speed the aero and weather editors.
- Interface complexity: Reduced, Standard, or Detailed. It controls how much the interface shows on its own: how many overview metrics appear and how detailed the editor panels are.
Both are asked for in the new-project dialog, but can be changed at any time in the Settings sidebar tab or through Layout Settings. They govern the default arrangement and the default metrics; a layout you have already customised stays as it is until you reset it or apply a template.
Saving and Auto-Save
Projects can be saved manually via the project button. Additionally, the auto-save mechanism saves your project automatically every 2 minutes; you can toggle auto-save on or off. The "Save As" function creates a copy under a new name.
Sharing and Privacy
Each project has a privacy setting:
- Private: Only you can view and edit the project.
- Public: A shared link allows others to access your project in read-only mode.
In read-only mode, other users can view the simulation and explore panes, but cannot make changes.
Comparison Mode (A/B Testing)
Comparison mode lets you build two scenarios in parallel and view their outcomes side by side. It is the core tool for any comparative race or equipment planning.
- Create scenario: Create a second scenario (B) that starts as a copy of Scenario A.
- Edit independently: Change power, aerodynamics, nutrition, or equipment in one scenario without affecting the other.
- View comparison: Every pane and metric shows both values along with the delta (difference). Green indicates improvement, red indicates a worse result.
- Copy: Copy Scenario A to B or vice versa to quickly create variants.
Common applications include comparing power distributions, nutrition strategies, equipment options, or riding positions.
Undo, Redo, and History
Every change is stored in the history (up to 50 entries). You can undo and redo changes at any time. The history dialog shows all stored states with timestamps and lets you jump back to any previous state.
Rapid consecutive changes (within 2 seconds) are automatically coalesced into a single history entry to keep the history manageable.